Which ads actually worked
Figuring out what each marketing channel is really contributing, with a range, not a made-up single number.
The problem
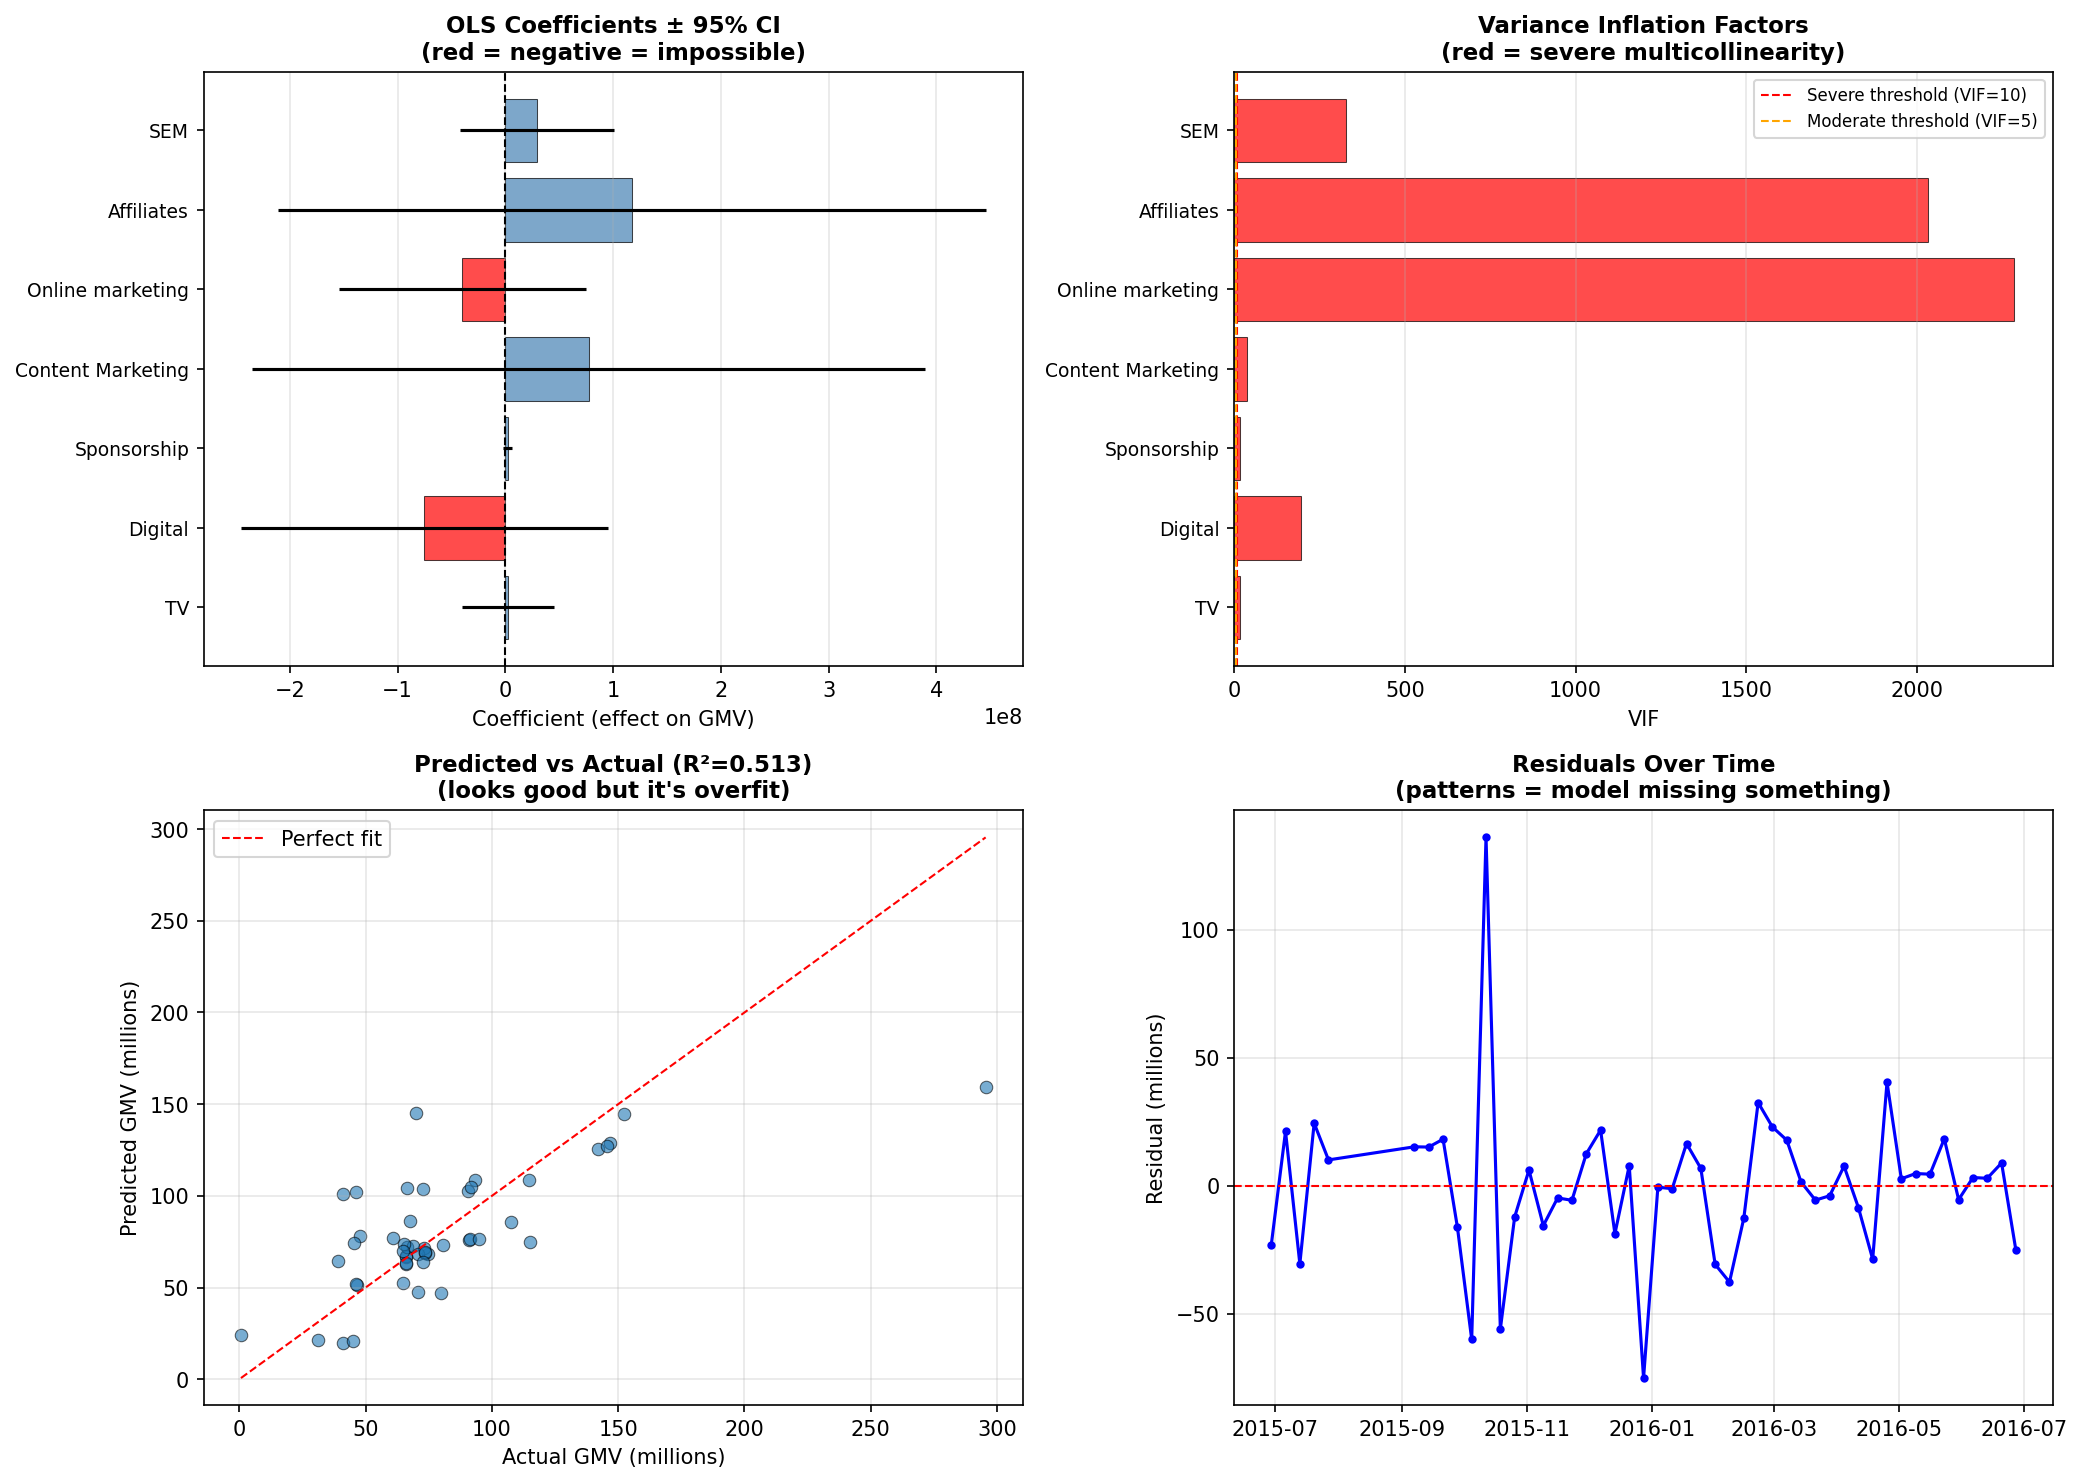
Their old model said some of their best-performing channels were actually losing money. That was a math problem, not a marketing one. When every channel ramps up together in Q4, the standard approach can't tell them apart and spits out nonsense.
What we built
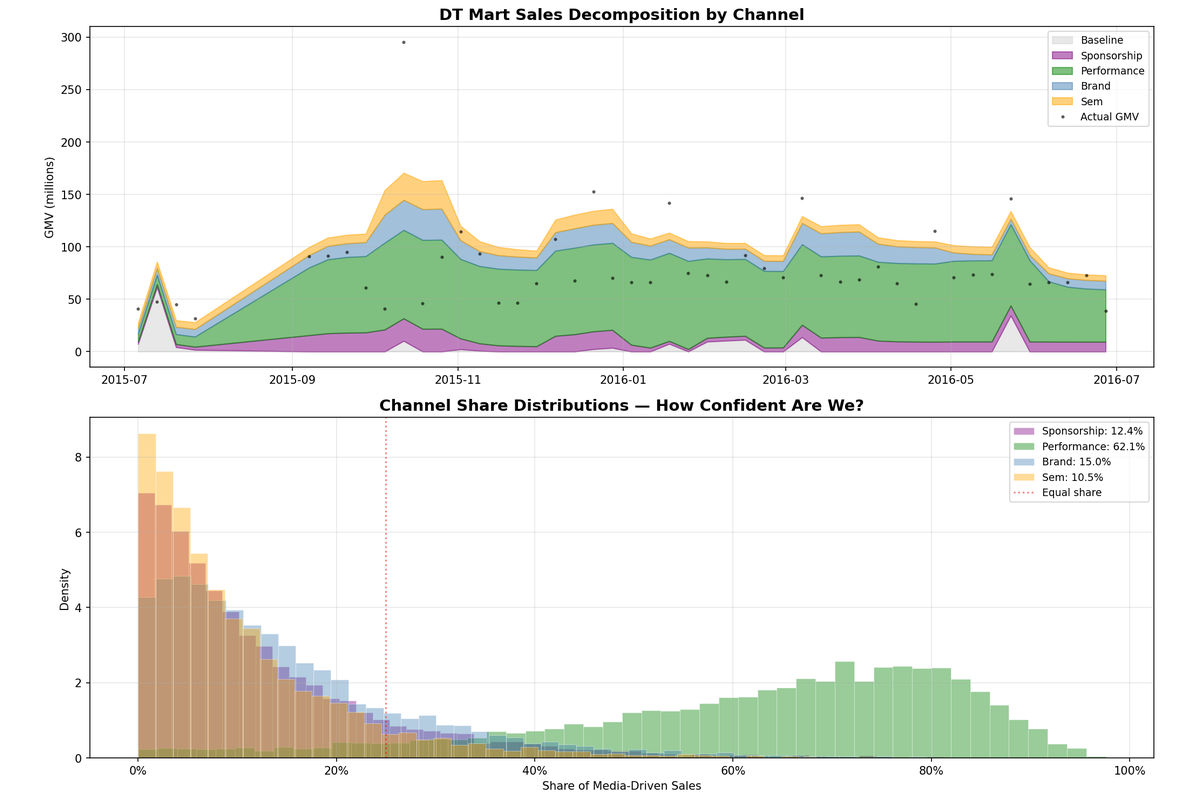
A statistical model that actually understands how marketing works: ads keep producing after you stop spending, every channel eventually stops adding lift the more you pour in, and attribution comes with a confidence range instead of a single number pretending to be precise. Each channel's reported contribution is a range the CFO can reason about.
Outcome: Spend moves from the channels that only looked good to the ones that actually work, with the uncertainty shown honestly.
Tools & techniques
Their existing model was a standard regression, the kind that breaks the moment every channel moves together, which is exactly what happens in Q4. We replaced it with a Bayesian model that bakes in how marketing actually behaves: spend keeps working after it's stopped, more spend eventually plateaus, and no channel can contribute a negative dollar. The output isn't a single number per channel. It's a range, so the CFO sees honest uncertainty instead of false precision.
A model that knows the rules of marketing
We told the model up front what's physically possible: a channel can't have a negative contribution, spend today keeps working tomorrow, and dumping more money into a single channel eventually stops adding lift. A normal regression doesn't know any of that, which is why it spits out nonsense when every channel moves in sync.
Carryover + diminishing returns
Each channel gets two extra parameters fit alongside the contribution number: one that controls how long spend keeps working after it's turned off (carryover), and one that controls when extra spend stops adding lift (diminishing returns). This is the piece a normal regression can't express, and it's the piece that makes the numbers hold up when the budget actually changes.
A range, not a single number
Instead of "Meta contributed $2.1M", the model reports "Meta contributed $1.8M–$2.4M". That range reflects real uncertainty. Nobody has to defend a number that was never that precise to begin with, and reallocation decisions get made with the uncertainty in view.
Defensible in a boardroom
The final deliverable is a reproducible notebook, a one-page summary of channel contributions with their ranges, and a simple reallocation tool that respects those ranges. When someone asks "why move budget from X to Y?", the answer is a comparison of two ranges, not a slide with a single made-up number.
Have a version of this in your own business?
Book a free 30-minute call. We'll walk what you're doing now and show you what's fixable.